How We Profile WebXR/WebGL Apps
This article covers methods for profiling WebXR and WebGL apps (independent of the underlying framework). Profiling is the first step to optimizing your application. Optimizing without Profiling is wasted effort, as described in Bottlenecks.
Note that the post does not address how to fix any of the found performance issues. There are many blog posts and talks targeting specific bottlenecks, but once you know what the problem is, you will find resources for it.
The metrics we will be profiling for are CPU time, GPU time, JavaScript heap memory, and application load time. The goal is to provide the most comprehensive collection of information on profiling for free. And no: “poly count” is not a metric we care about!
### ContentsBottlenecks
Without finding the bottleneck of your app, your efforts to optimize will not be effective.
Example
Imagine you are rendering a large scene with many objects. Your app is barely reaching 60 fps. You can optimize every one of the object’s vertex counts and still remain at 60 fps.
The CPU is responsible for sending the GPU the command to render each object (“Draw Call”). In this case, it is way more likely that the CPU is overloaded with the work to send the draw calls, while the GPU is just twiddling its thumbs waiting for the CPU to send more work!
But we don’t know… until we measure. That is what Profiling is for.
Bottleneck Types
Any part of an application can cause a bottleneck. Here are some examples of common bottlenecks in order of frequency:
CPU Draw Calls: Too many calls to the driver cause too much overhead.
Garbage: The application is performing fine, but produces garbage that causes hitches at regular or irregular intervals.
CPU Logic: Your application is unable to produce work for the GPU fast enough. Often caused by heavy physics simulations or ray casts.
GPU Fragment Shading: The per-fragment performance cost is too high.
GPU Vertex Processing: Per-vertex processing requirement is too high.
GPU Resolve: Caused by post-processing on mobile GPUs.
GPU Vertex Fetch: Memory for the vertices is not read fast enough.
Each could have sub-bottlenecks.
Metrics
The metrics we will be profiling for are:
CPU Time
Work for any XR application is split between CPU and GPU. The CPU is responsible for preparing the graphics work for the GPU to render and runs the app’s logic.
Any JavaScript code will run on the CPU to prepare draw calls, perform resource loading, simulate physics, render audio and compute scene graph transformations.
GPU Time
The GPU is responsible for graphics heavy lifting. While the CPU will send a draw call along the lines of “draw mesh X with shader Y with texture Z and material parameters W”, the GPU will perform the actual rasterization and per-vertex transformations to produce the pixels on the screen.
The GPU is also responsible for sending the final image to the screen, waiting for “V-Sync” which synchronizes the screen’s refresh rate with that of the application.
Frame Rate and V-Sync
We do not use frame rate (frames per second = fps) to profile our application.
This metric is only listed to explain the complexity of understanding how performance interacts with V-Sync. It is too coarse to make useful judgments with.
Consider V-Sync as fixed deadlines: 60, 72, 90 or more deadlines per second (the frame rate). We will refer to “making V-Sync” as having rendered and submitted the frame on time for making the deadline.
When you miss the deadline, all your work is discarded and you need to try to catch up to make the next deadline instead. In flexible-frame rate environments, this can mean that your drivers will drop you to half the frame rate.
If your application is just barely too slow, this means you would be seeing e.g. 30 fps instead of 59 fps, telling a completely different story. Maybe your application is performing decently with 3ms CPU and 3ms GPU time, but because the work starts late, you miss V-Sync for your target frame rate—which cuts your effective frame rate in half. No vertex count, draw call, or any classic optimization will help you here.
Latency
Latency, the time between input (e.g. head movement) and the finished frame, is especially important for VR. WebXR implementations will usually take care of this for us and might schedule the frame callbacks a bit later, if we don’t use our frame budget, to reduce latency. We have limited control over this from WebXR and will therefore not cover it in this blog post.
Garbage Collection
JavaScript comes with memory management that allows you to treat allocations carelessly and without thought. Hence it is common to do so.
Without the need for managing memory, you lose the control to specify when you want to have your memory be managed. This process is called “Garbage Collection” and will occur at random times in your application life cycle—e.g. when you would have made V-Sync and were just about to submit your frame.
Garbage collection might take 0.1 - 10 ms. Considering your usual VR frame budget is 11 ms, you absolutely don’t want this to happen at random moments in time.
So how do we avoid it? The only way is to avoid any garbage that would need cleanup. The less you produce, the smaller and rarer the garbage collection hitches will be.
Application Loading Time
Just as with website loading, the user’s commitment to using your app decreases with every second spent waiting for it. Since WebXR applications are fairly large, there might be a bit more goodwill here compared to a Website, but there is no need for this.
By starting the application early and loading resources that aren’t immediately needed later, we can reduce the perceived load time.
By optimizing assets and ensuring our server settings are optimal, we can reduce the loading time in general.
And by using formats that need less parsing, we can reduce the amount of work the CPU needs to do after downloading the resources.
Tools
In this post, we will cover the following tools:
- Chrome Profiler, [CPU, GPU, Garbage]
- Chrome Networking tab, [Loading Time]
- OVR Profiler Tool, [CPU, GPU]
- Spector.js browser extension, [CPU, GPU]
- WebGL Disjoint Timer Query, [GPU]
- Wonderland Editor Profiler (Wonderland Engine only). [CPU, GPU]
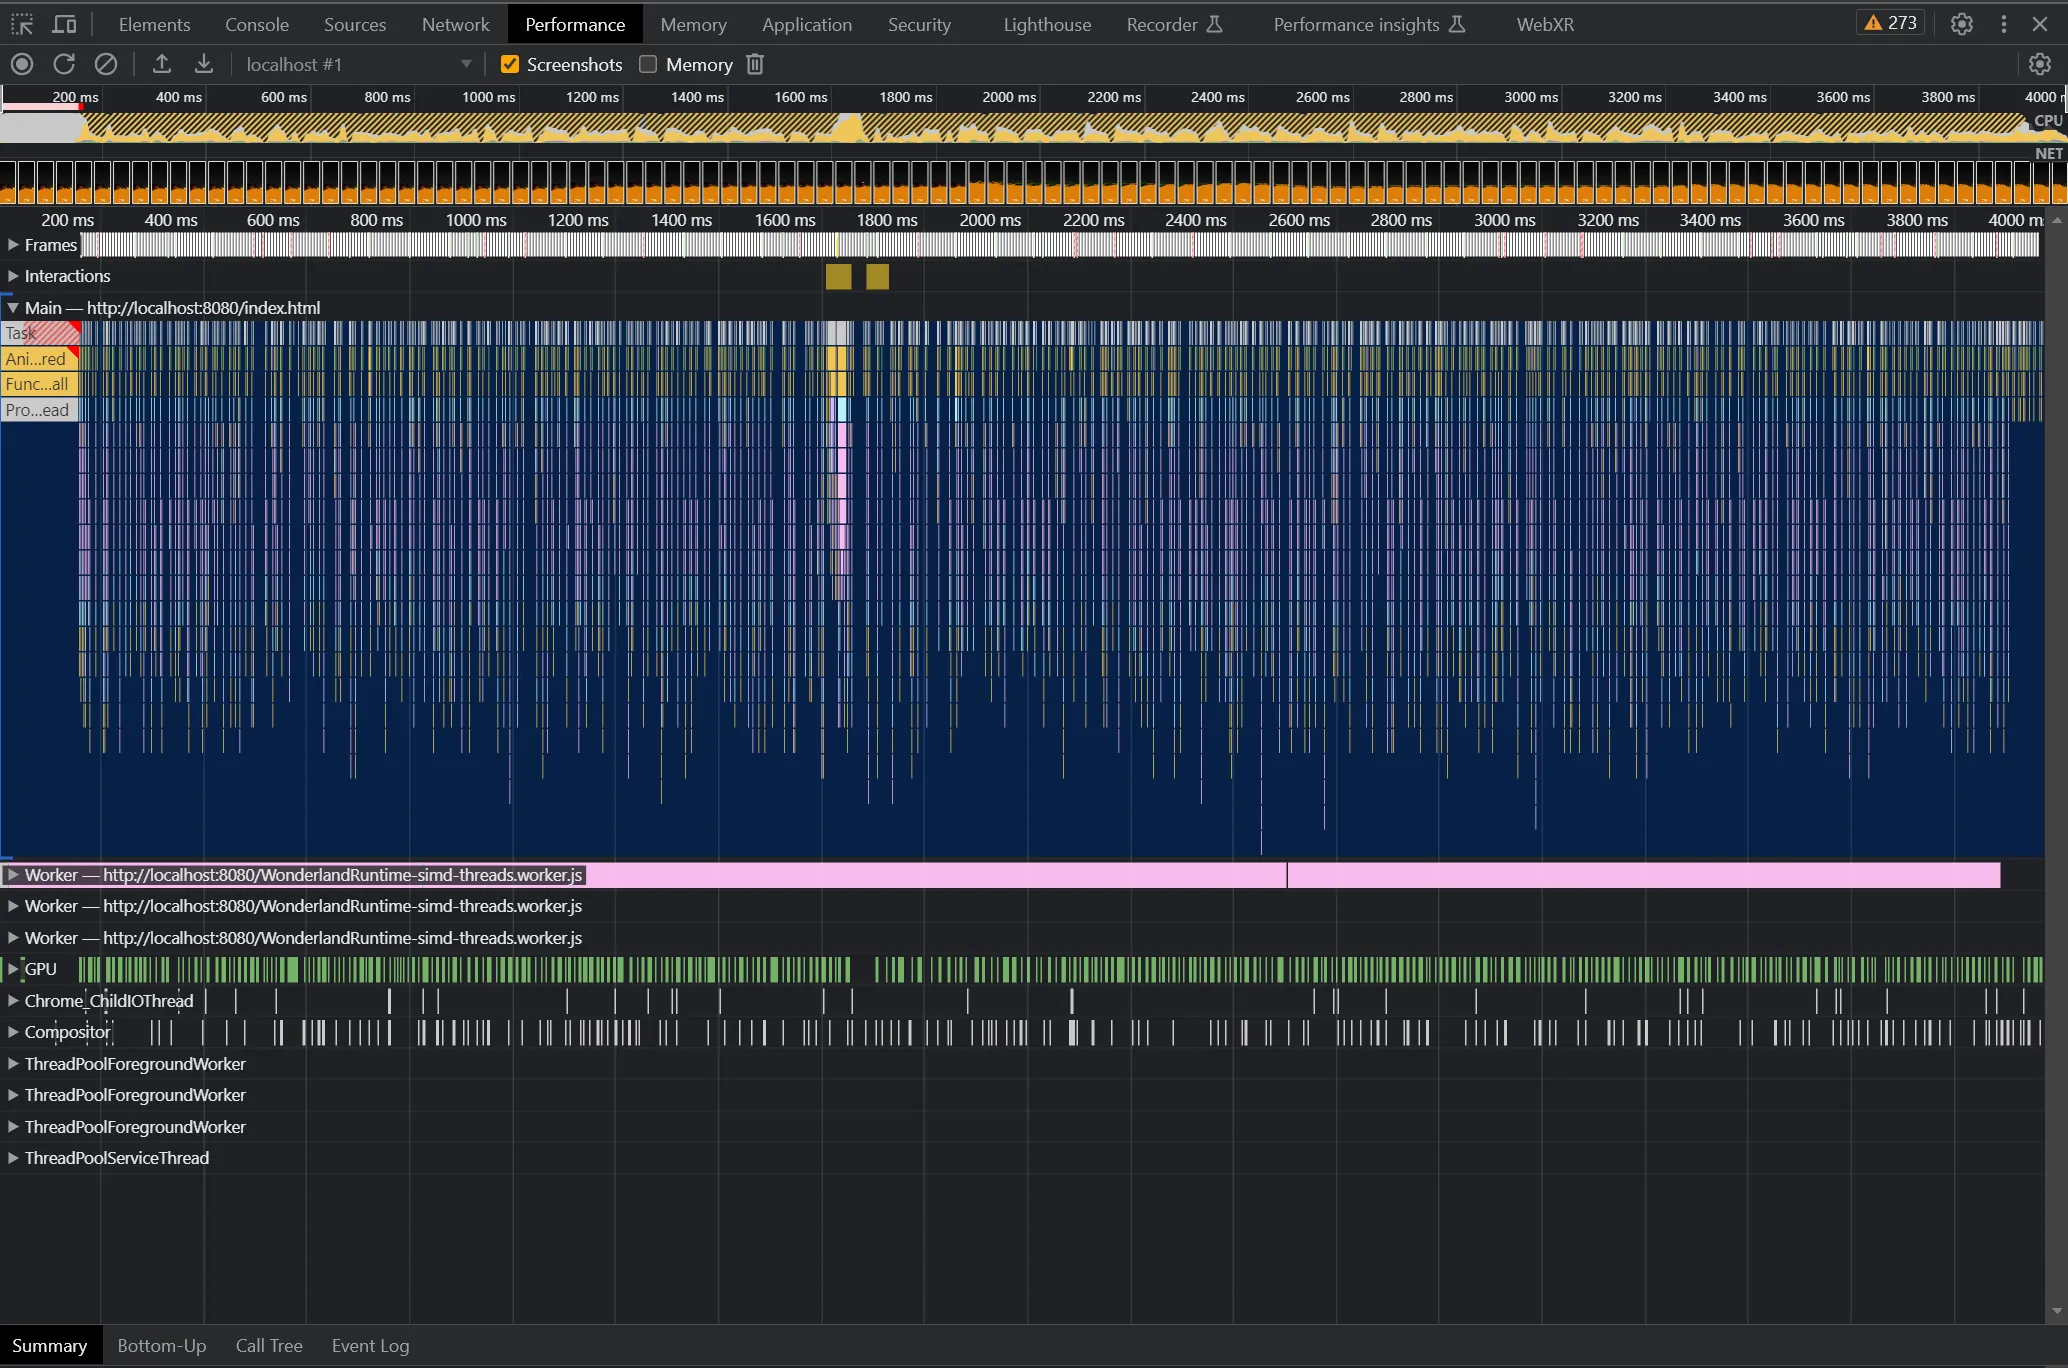
Chrome Profiler
Chrome’s built-in profiler will allow you to profile your JavaScript CPU time, Garbage Collection, and very roughly your GPU frame time.
You can find the Performance tab by navigating to any website and pressing Ctrl + Shift + C
(Command + Shift + C on MacOS). Find “Performance” there.
To record a profile session, hit the record button on the top left (Ctrl/Command + E).
3-5 seconds is usually fully sufficient as we are interested in single frames usually.
This works also when Remote Debugging on Android Devices like Meta Quest or your smartphone.
Safari has a similar profiler for Mac, iOS devices, and the Apple Vision PRO (e.g. with Safari running in the Apple Vision PRO simulator).
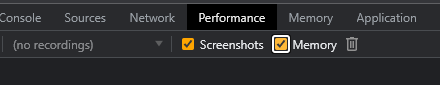
Chrome Memory Profiler
In Garbage Collection we describe stutter in otherwise smoothly running applications.
To find that bottleneck, Browsers provide a way to sample the JavaScript Heap. This is how you enable it in Chrome from the Chrome Profiler described above:
Example
The following is a profile on Meta Quest 2 from Elysian, which is based on Three.js:
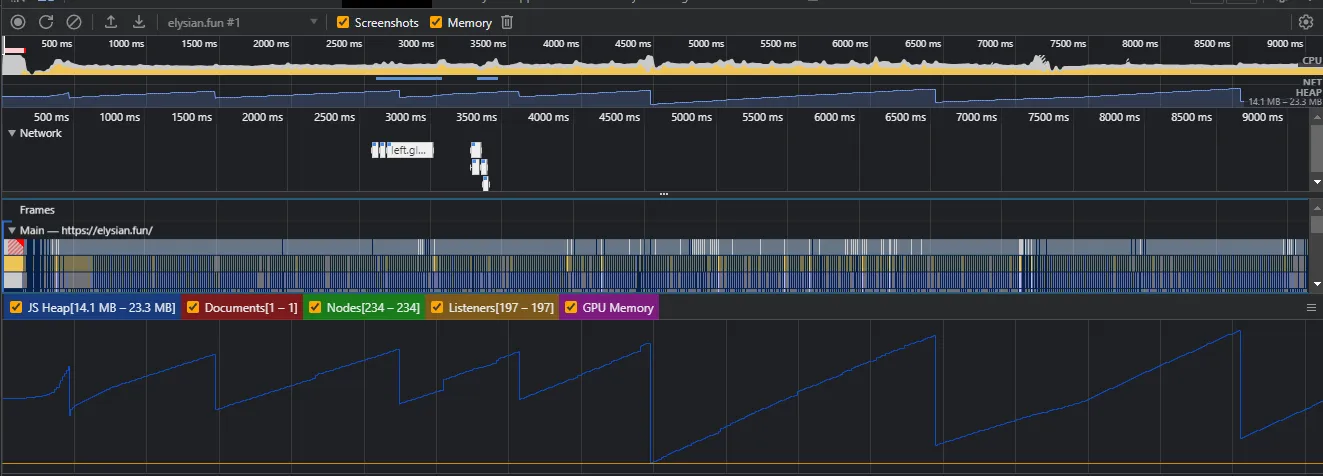
You can see that the “JS Heap” fluctuates between 14.1 MB - 23.3 MB.
Wherever the memory drops suddenly, we find Garbage Collection occuring. In this case, the GC is so large that it delays the next frame start, causing a dropped frame:
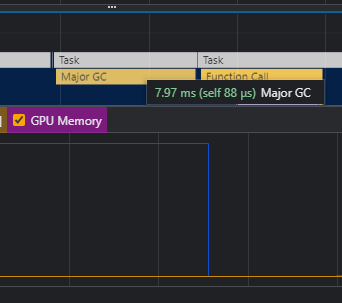
As a result, we have to hope that the dropped frame is reprojected from the last frame, otherwise, significant stutter will occur. Since animations cannot be reprojected, there will be some stutter either way.
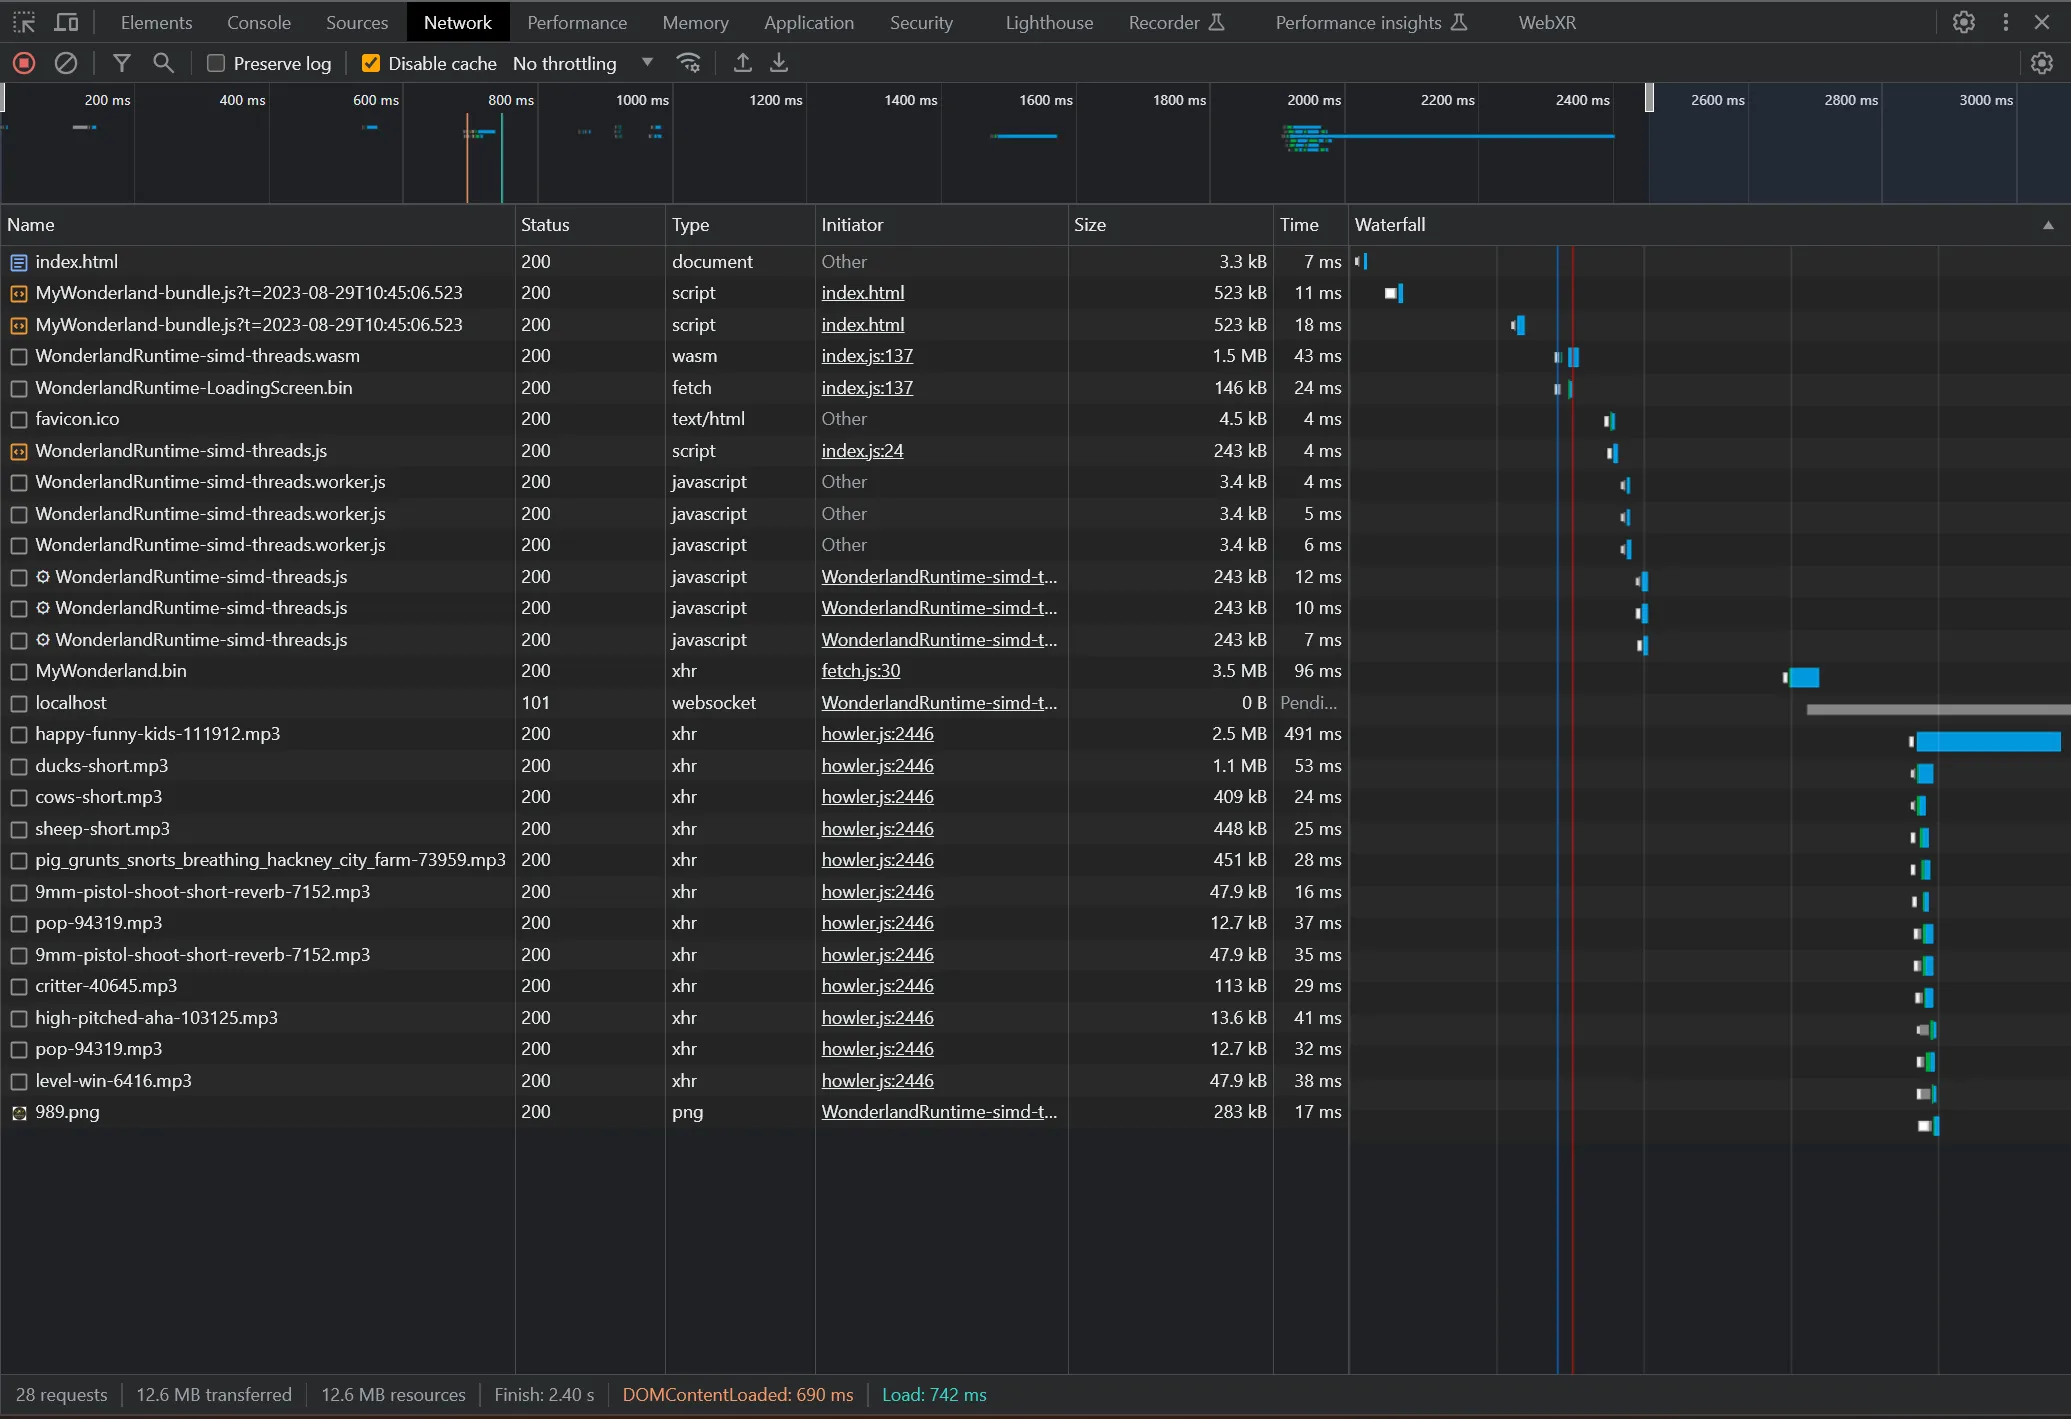
Networking Tab
Any browser’s networking tab is a great tool for profiling your Application Loading time.
You can find the Networking tab by navigating to any website and pressing Ctrl + Shift + C
(Command + Shift + C on MacOS). Find “Networking” there.
To record the networking activity, reload the page while having the tab open.
Blocking Downloads
If a resource is not needed immediately at application start, it should be loaded later, since browsers will only run limited parallel requests at a time (e.g. 6 for Chrome).
Meta Quest Performance HUD
When profiling VR rendering on the Meta Quest, you can use the Performance HUD.
It is most easily installed via the Meta Quest Developer Hub.
This is especially useful for debugging view-dependent performance problems, since you can use the headset while getting continuous feedback on performance.
Example
In the example below, Ayushman Johri shows the excellent performance of his Wonderland Engine-based “Vintage Study Room” using the Meta Quest Performance HUD:
Here’s a performance test with the @MetaQuestVR FPS Graph!
— Ayushman Johri ✨ (@AyushmanJohri) August 19, 2023
I will mention that I observed more stale frames than I would get without system recording~
Also for artistic choice, I decided to use uncompressed textures for some extra detailed assets ✨
Not perfect but pretty close! pic.twitter.com/MLzWVLHItn
OVR GPU Profiler
If you run into vertex or fragment shading bottlenecks, you will appreciate a clearer understanding of what is taking most time in your shaders.
The ovrgpuprofiler is a very sharp tool. If you have some understanding of GPU memory and architecture, it gives you a lot of insight.
It is run by installing it on your Meta Quest headset via adb and running it via adb shell:
    47 metrics supported:
    1       Clocks / Second
    2       GPU % Bus Busy
    3       % Vertex Fetch Stall
    4       % Texture Fetch Stall
    5       L1 Texture Cache Miss Per Pixel
    6       % Texture L1 Miss
    7       % Texture L2 Miss
    8       % Stalled on System Memory
    9       Pre-clipped Polygons/Second
    10      % Prims Trivially Rejected
    11      % Prims Clipped
(Source: developer.oculus.com)
Example output will look as follows:
$ adb shell ovrgpuprofiler -r"4,5,6"

% Texture Fetch Stall                      :           2.449
L1 Texture Cache Miss Per Pixel            :           0.124
% Texture L1 Miss                          :          20.338

% Texture Fetch Stall                      :           2.369
L1 Texture Cache Miss Per Pixel            :           0.122
% Texture L1 Miss                          :          20.130

% Texture Fetch Stall                      :           2.580
L1 Texture Cache Miss Per Pixel            :           0.127
% Texture L1 Miss

...
(Modified from: developer.oculus.com)
You will often read that reading and writing memory are usually the most expensive operations in a shader program. Whether this is true depends on how cache-friendly your memory operations are, though.
L1 (“Level 1”) cache memory is incredibly fast. To ensure you are using it, make sure you obey the principle of locality: access memory that is close to the memory you previously accessed.
Spector.js
Spector.js is a browser extension for Chrome and Firefox that allows capturing WebGL frame traces. The tool can show the full list of commands and summarize stats like vertex counts and draw calls.
Install it from the Chrome Extension Store or the Firefox Addon Library. You can alternatively embed the tool via HTML tag for browsers without plugin support.
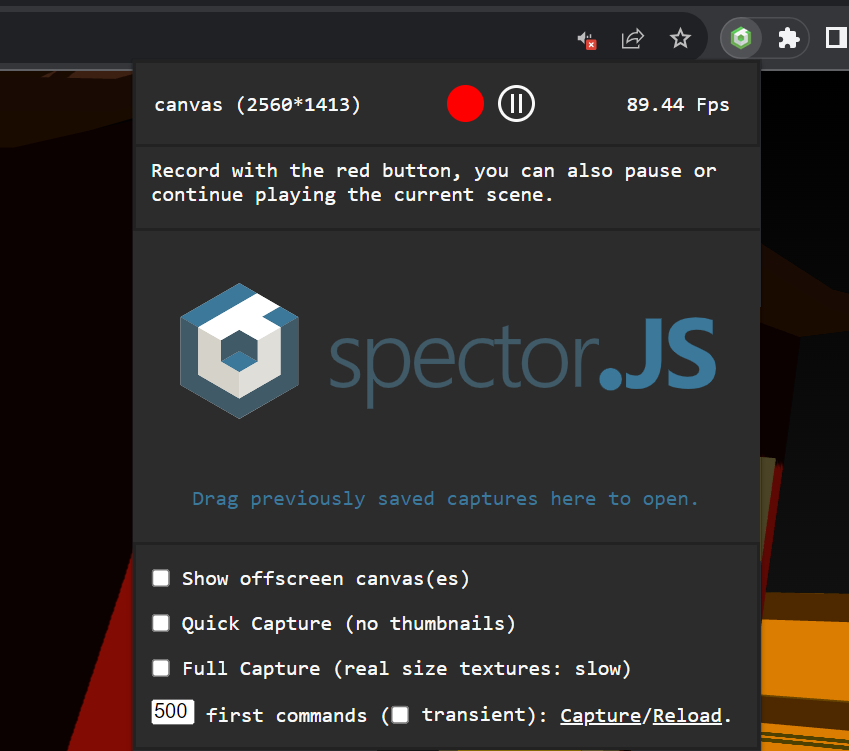
First enable the tool via the add-ons button at the top, then record a frame by clicking the red record button.
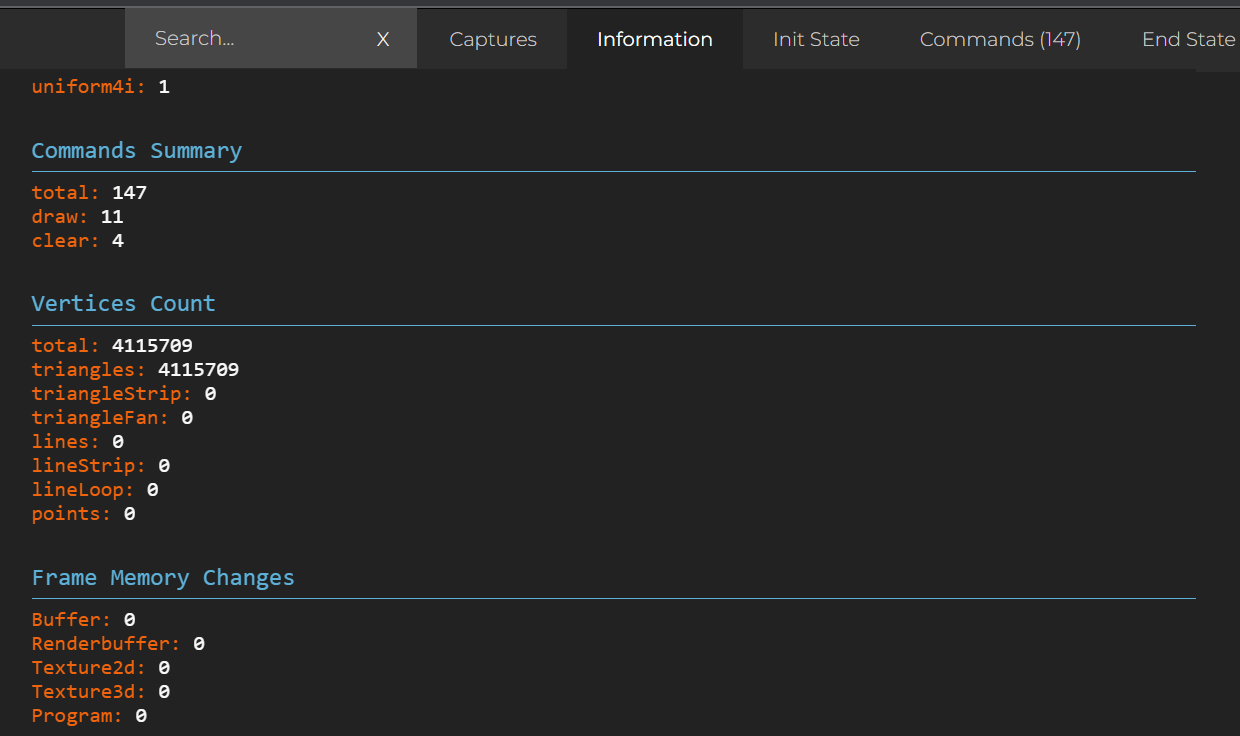
You can see that Wonderland Engine is drawing many many objects in a total of 11 draw calls here. For any other framework, this number will be 10-100x as high.
Disjoint Timer Query
EXT_disjoint_timer_query extension is an WebGL extension that allows measuring the GPU time of a set of WebGL commands. It is only supported well on Chrome [August 2023] and if the “WebGL Debug Extensions” Chrome flag is enabled.
Since all commands run asynchronously on the GPU, the time measurements need to be scheduled asynchronously as well.
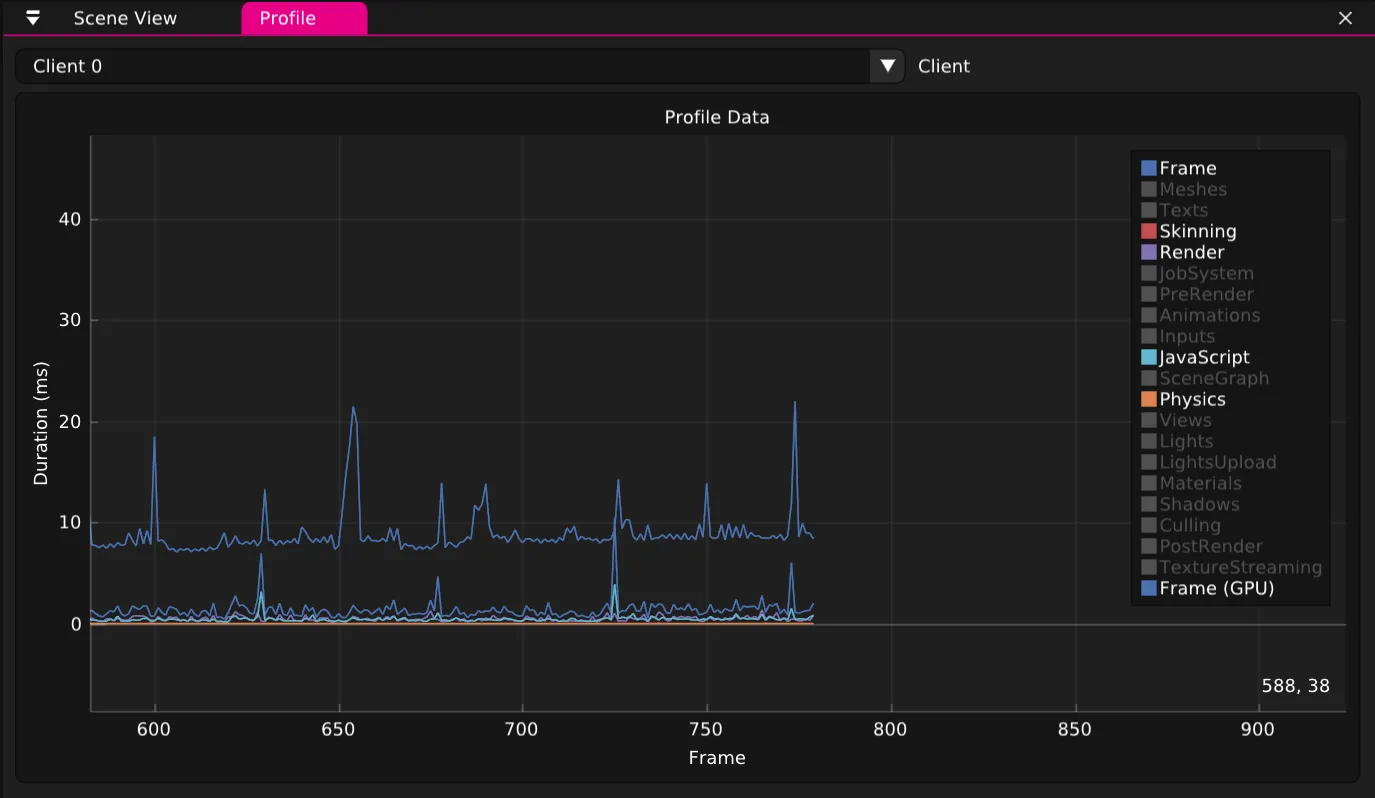
Wonderland Editor Profiler
Wonderland Editor comes with a built-in profiling tool that helps understanding where the performance of your WebXR app might be suffering.
Closing Words
Every framework has its particular performance characteristics. Most are draw call bound before anything else, and then fragment bound—no need to go low poly if not at 90 fps!
We designed Wonderland Engine from the ground up to avoid most of the above bottlenecks— it’s free up to 120k USD revenue per year. Reach out here for Enterprise Licenses and Support.
Try Wonderland Engine now and start saving time optimizing.